Previously I wrote about the basics of transactional databases. In this post, I’ll outline why you don’t necessarily want to build your analysis on top of a transactional database, and instead why you’d be better off using (or building!) an analytical database.
Different Paradigms
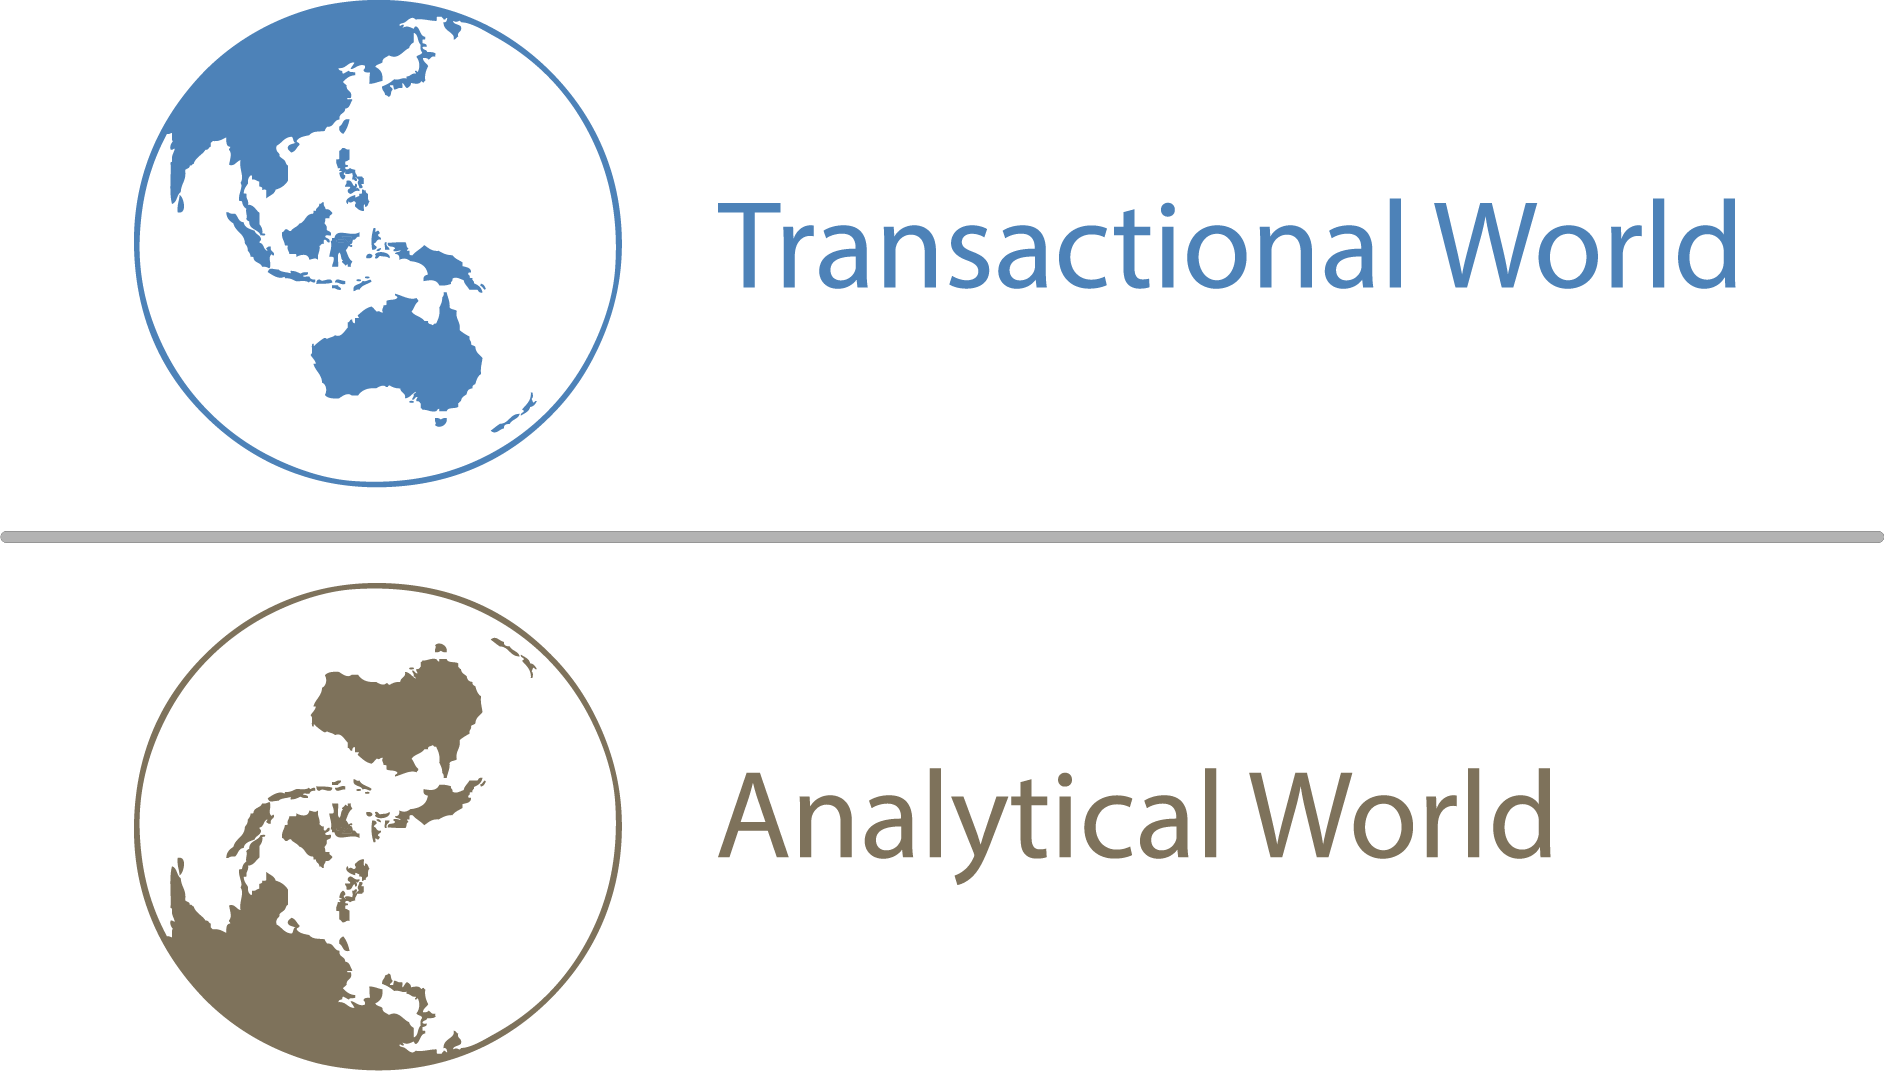
We live in two worlds. The first is the transactional, where users are busy creating quotes, taking orders, raising invoices, and keeping customer details up to date. These people follow core business processes and are the life-blood of any company.
The second world belongs to those analysing the business. Asking questions to figure out not only what is happening in the business, but also why. This kind of analysis mostly involves aggregating and slicing data by different dimensions, and seldom requires digging into individual transactions.
These two worlds need systems that are optimised for different tasks. The same reason that makes transactional databases “fast” at data-entry is also what makes them poor partners for analysis, their entity tables (e.g. Sales Orders) are normalized (i.e. split) into many smaller sub-tables.
Why does having a normalized schema make analysis difficult?
Because any calculation will require performing some form of join on the tables to de-normalize them into a consolidated table.
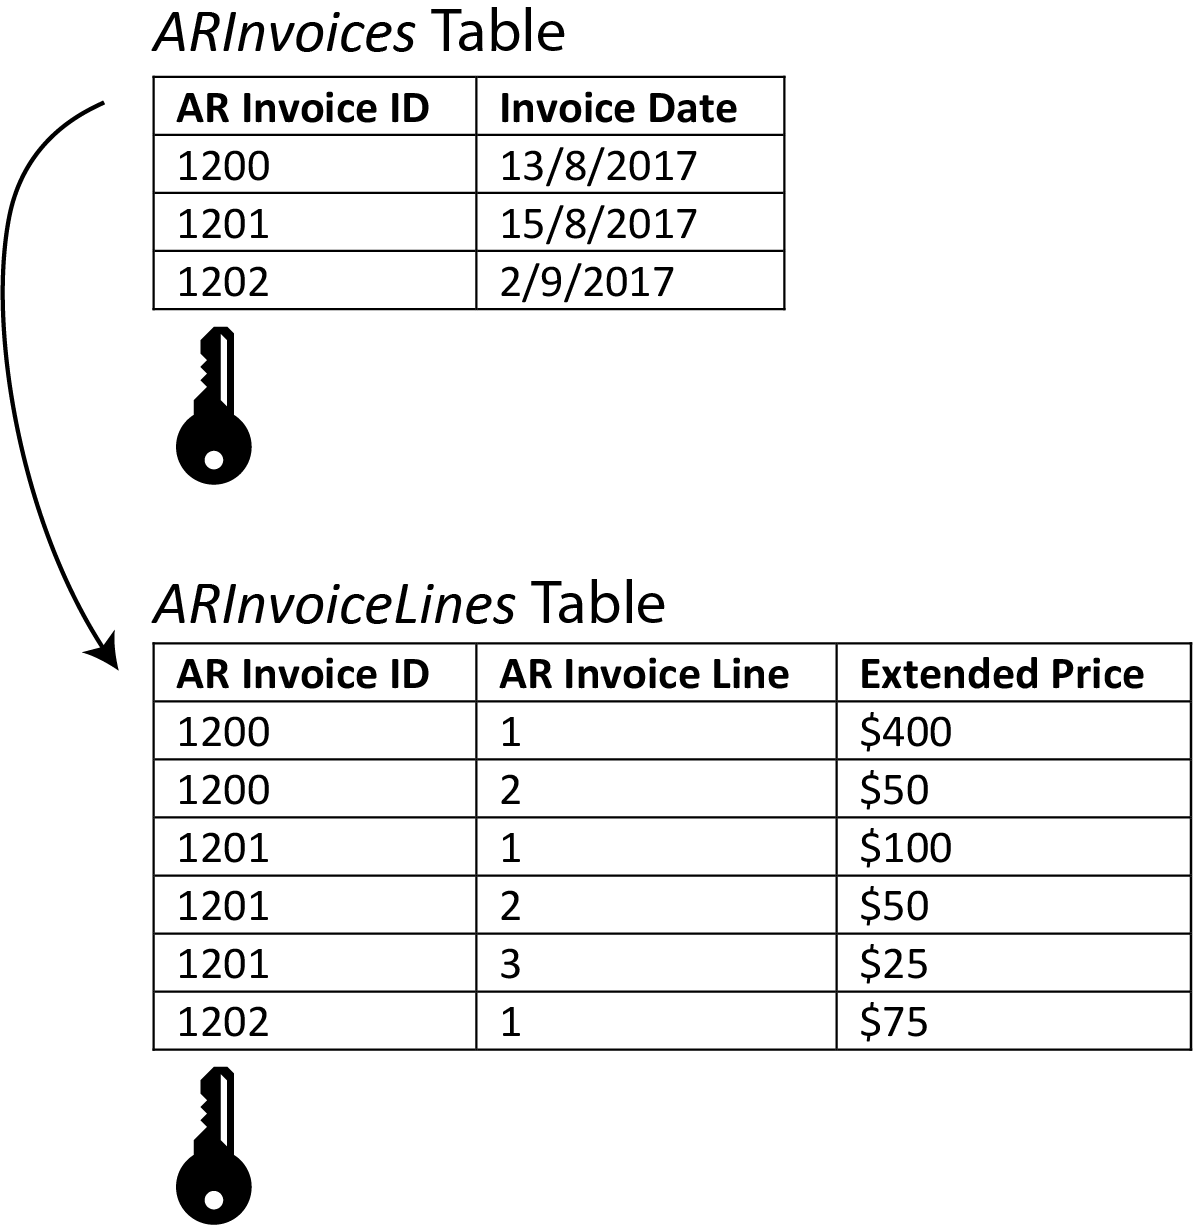
Picture trying to calculate the total amount of sales per day. You have two tables, ARInvoices (short for Accounts Receivable), and ARInvoiceLines. ARInvoices only contains the ID of the invoice and the date. ARInvoiceLines only contains the ID of the invoice, the ID of the line, as well as the total sales value of the line.
If you pulled the tables out of your database into Excel, you’d probably use a VLOOKUP on your ARInvoiceLines table to your ARInvoices table, pulling across the date next to each line. If you knew what PivotTables were, you would make a simple PivotTable on top of your new ARInvoiceLines table (with the dates). Within the PivotTable you’d then drag the Sales amount directly into the “values” box and the date into the “rows” box.
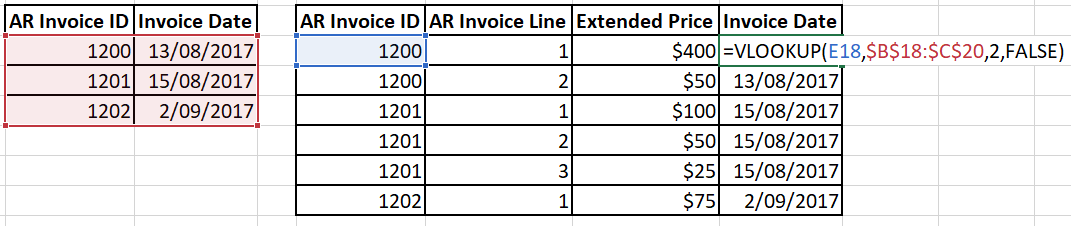
While I’ve strayed a bit into Excel territory, the gist is that you must do this “joining” of your tables to get them in an easy-to-use state.
So how can you make performing analysis easier (…as well as your life!)?
Well, you basically just pre-perform all the necessary joins.
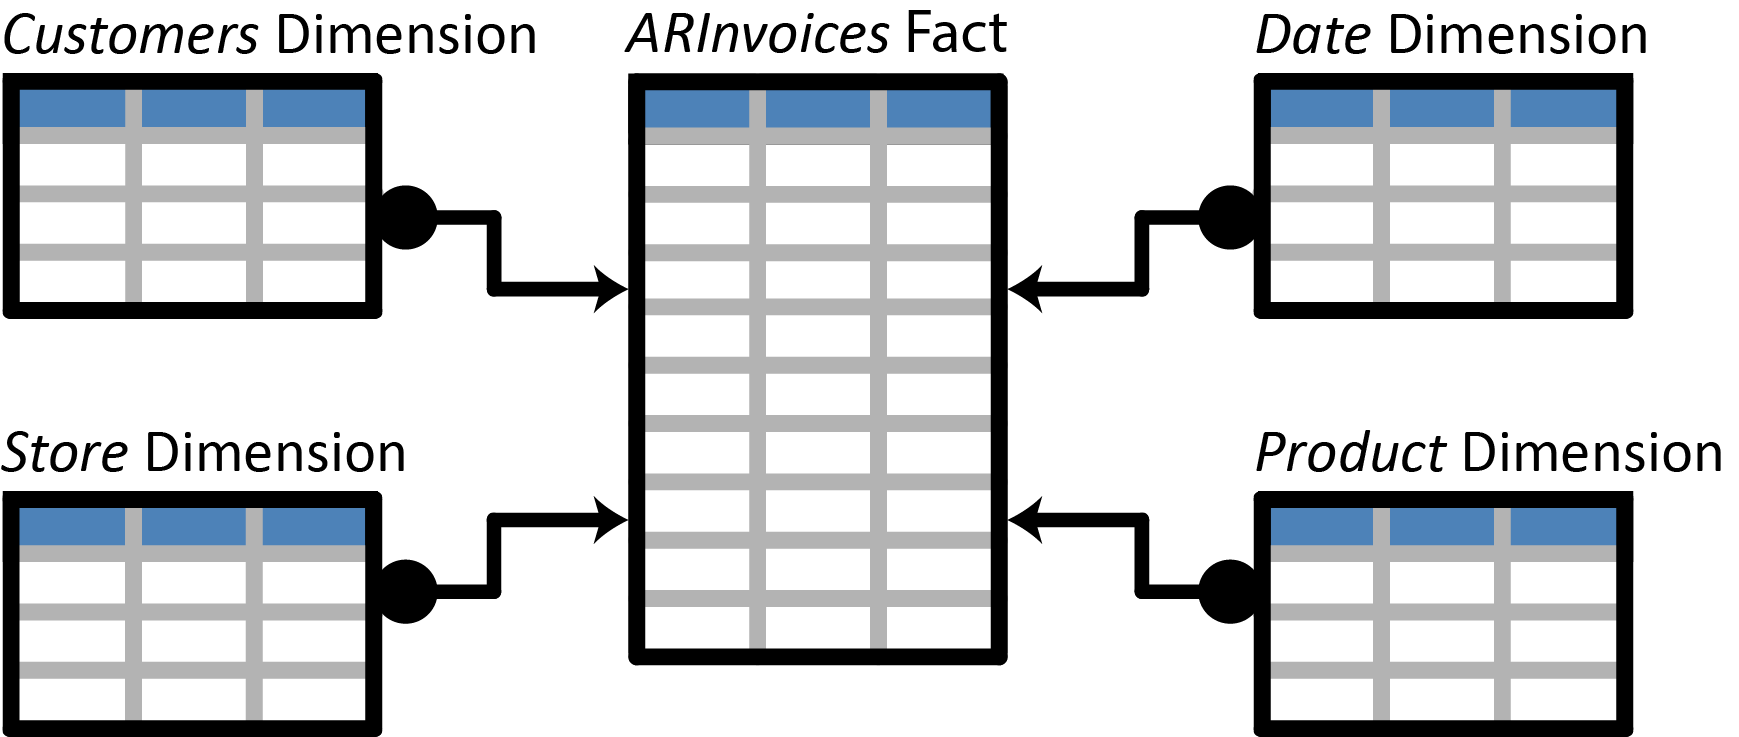
In doing this, even though you might not have realised it, you’ve started “dimensional modelling”, an appropriate word for arranging your tables into “dimensions” and “facts”. Fact tables contain the numerical values of any transaction that’s occurred (think Sales or Purchases tables), while a dimension table stores detailed additional information (such as Customers, Stores, the Date, or Products). A fact table will have a relationship between all the relevant dimension tables.
Just a reminder, these entities (whether they are dimension or fact tables) should be flattened (i.e. denormalized) where possible. You only want one table to describe one entity. This flattened arrangement of entities is often known as a “star” schema.
Snowflake vs Star Schema
A schema is kind of like a blueprint for organizing data. One of the choices you make when designing a database is how you’re going to organize the tables within it. Traditionally, a transactional database has always followed a “snowflake” schema, where you have branching tables related to their sub-tables as well as dimension tables. The nice way of describing the resulting relationship diagram is that it looks like a “snowflake”, but in reality if you have many tables it’ll instead look like a hot mess.
A “star” schema, on the other hand, is named after the fact that it collapses all of the fact tables into singular tables for each entity (i.e. Sales, Purchases, InventoryTransactions, etc.) The result is that it’ll look much simpler and be easier to understand. Wherever possible I recommend you always try to simplify the schema of your analytical database to fit a star schema.
Data Warehouse vs OLAP Database
So far I’ve tip-toed around describing what an analytical (or Online Analytical Processing) database is, mostly because they do more things than they used to. They’ve also started stealing some of the functionality (and thunder) associated with data warehouses.
A data warehouse collects and simplifies an organization’s data assets. It usually follows dimensional modelling concepts, including de-normalizing tables and tracking historical data. Often it will also change many of the IDs used from natural keys to surrogate keys, and in doing so act as a layer of abstraction for any reports built on top of it. A data warehouse is usually built using a standard relational database engine, the same that powers a transactional database (such as the standard database engine in SQL Server). Most of the time a data warehouse is just a re-arranged transactional database that will have new data dumped into it on a predefined schedule.
In contrast to a data warehouse, an OLAP database goes further in that it also creates predefined calculations aka “measures” that can be used for building reports. Measures range from simple calculations such as the sum of all sales, to calculating overdue invoices over time. Because the measures are created when designing the database, rather than when building individual reports, you can be sure that all reports using a measure will share the same answer and you’ll be able to have that golden single version of the truth.
An OLAP database is traditionally built on top of a data warehouse, but recently the lines are beginning to blur to the point where simple business intelligence projects don’t require a separate database for a data warehouse, and can instead just perform the necessary transformations directly in the development of the OLAP database (i.e. in SQL Server Analysis Services Tabular mode you can use the Power Query implementation to perform just about every transformation you’ll need).
Summary
So now that you know you probably want to build an OLAP database, how do you go about doing that? And what kinds of OLAP databases are there? Read on for a brief comparison of multidimensional vs tabular OLAP database modes.