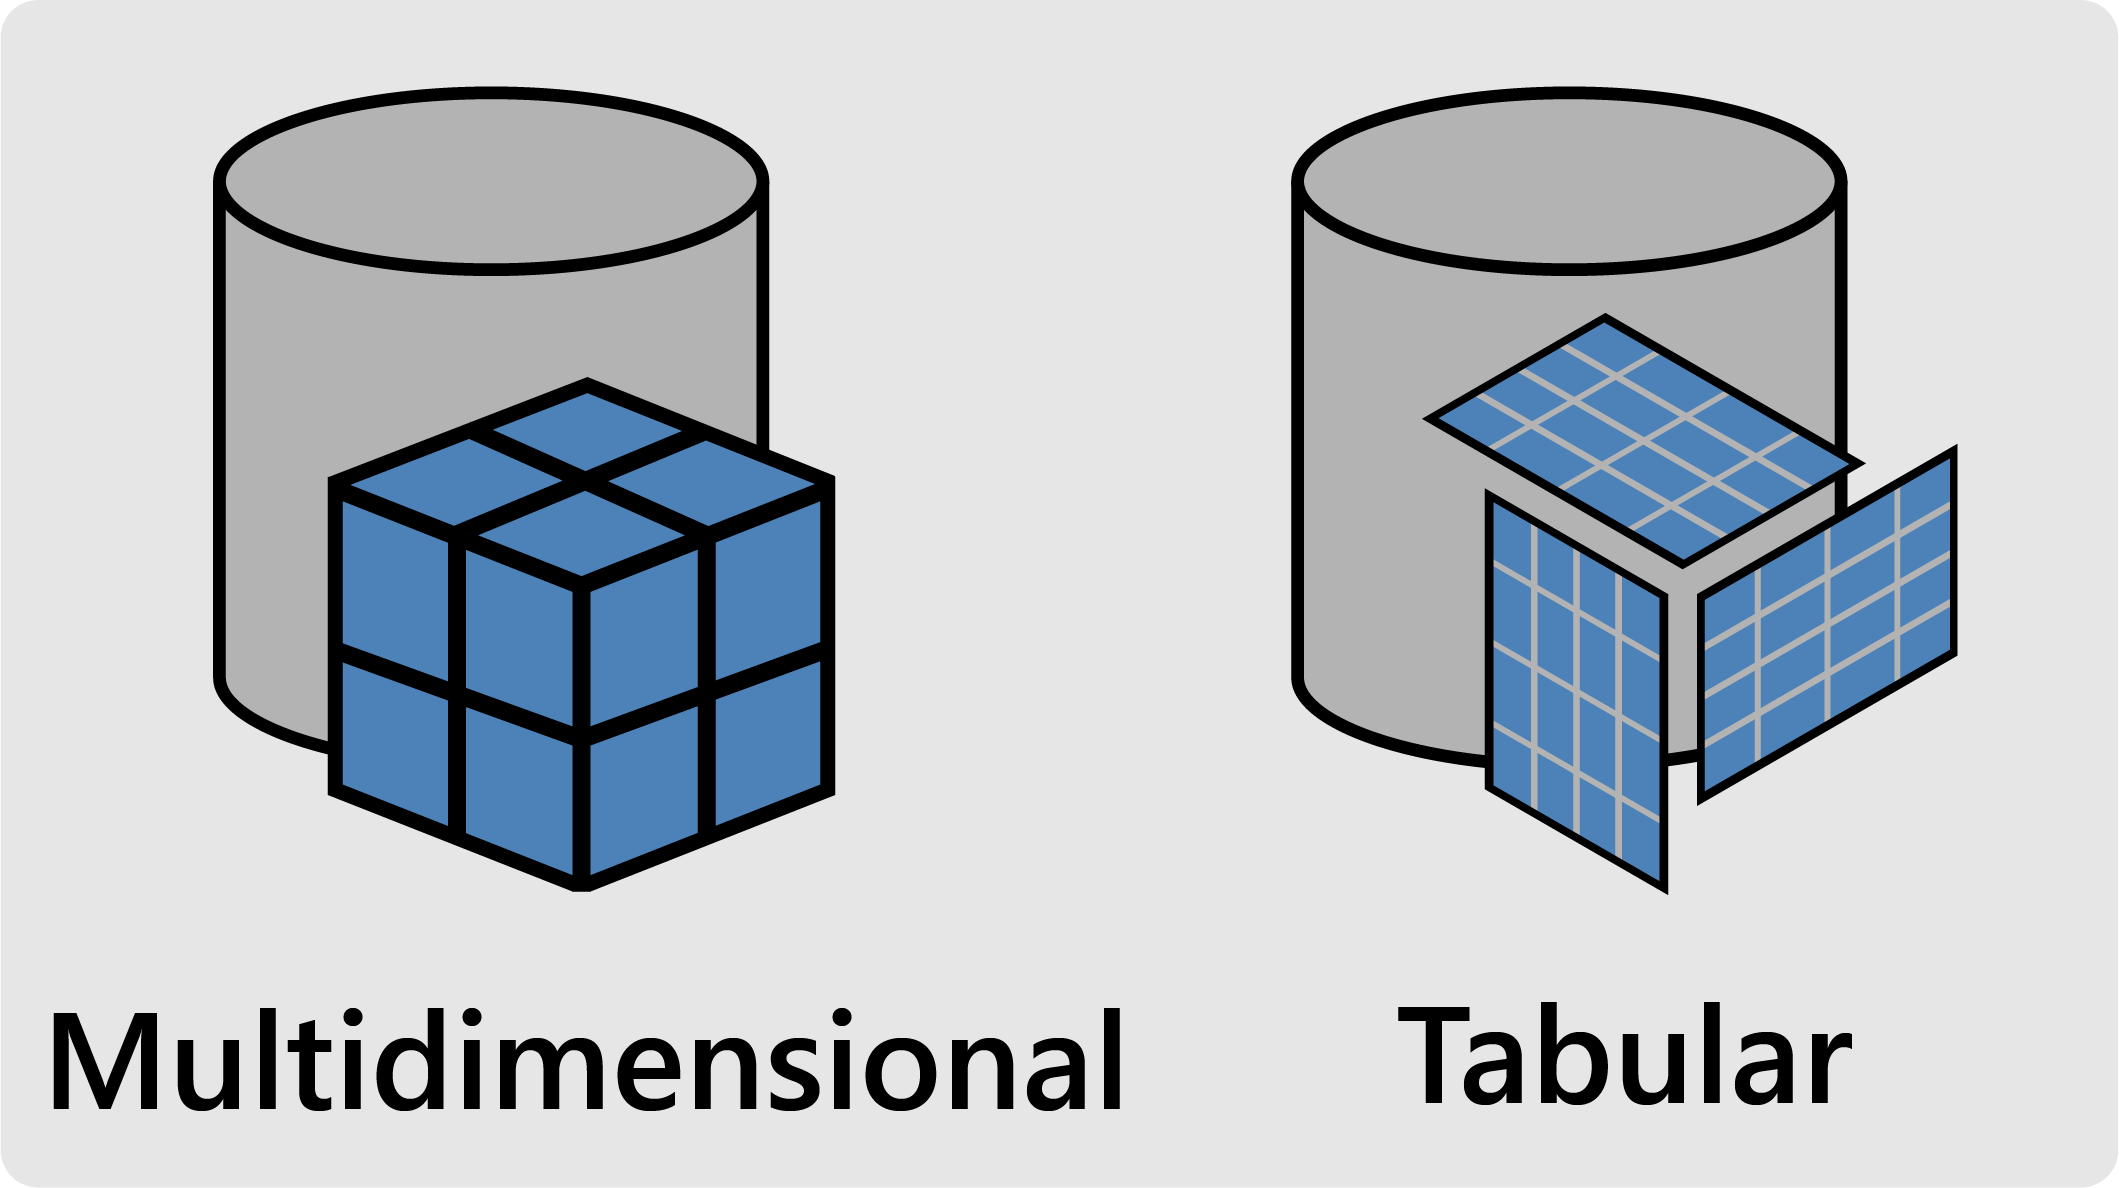
In this post, I’m going to do a quick comparison between multidimensional and tabular data models, and hopefully give you some intuition about why they have the features that they do.
What problem do they solve?
First up, why even create a data model? In essence, they exist to assist you with recurring analysis of your data. While they can still do ad-hoc analysis of problems or experiments, they’re best suited for questions you’ll likely be asking again and again (or simple variants of the same question), such as “why were sales so low this month? Why does the company’s gross margin seem to be dropping? Why are my customer deliveries becoming less on time?
How do you interact with them?
You can interact with these data models through different client applications, including custom developed applications via client libraries.
Standard client applications include Excel (via PivotTables, PivotCharts, and cube formulas), Power BI (via live connection and data import modes), and SQL Server Reporting Services.
Where do you find them?
Multidimensional models can be deployed to SQL Server all the way from SQL Server 7 (’98) to the current version. Tabular models can be deployed to SQL Server 2012 to the current version, as well as to Azure Analysis Services. You can also develop tabular data models within Excel and Power BI workbooks that are embedded within the workbook (which is a great way to get started with Tabular).
Feature comparison
The differences between the types of data models are mainly found when you’re authoring them. This is because the newer tabular models were designed so that client applications don’t know whether they are querying a multidimensional or tabular model. To the user it doesn’t seem like there are two different types.
Multidimensional Model Types
In multidimensional you define different dimensions and then measures that will aggregate along those dimensions. In doing this you’re developing a “cube”, with multiple different kinds of aggregations.
MOLAP vs ROLAP
Within multidimensional you can choose how often you’ll perform the loading and processing from the underlying data. If you want to refresh the data every hour, you can set up a task to “process” the database by ingesting the data and performing all of the different aggregations against each combination of dimension. When someone then queries your OLAP cube all they’re doing is querying a calculated number that might be rolled up from the lowest level dimensions. This type of multidimensional modelling is called MOLAP, as in Multidimensional Online Analytical Processing.
What if you want your data to always be up to date?
Well, then you’d deploy your multidimensional model in ROLAP mode (R for “relational”). In this mode instead of periodically processing and aggregating all of your data amongst the dimensions, you instead just perform them on an as needed basis or do pass-through (as in you pass the query from the OLAP database through to the underlying relational database). The benefits are that your data is always fresh and you don’t need additional storage for the OLAP database (because it doesn’t hold any of its own data, it just passes the queries on). The downside to ROLAP is that the underlying database must be relational (e.g. SQL Server or Oracle), and that query response times are much slower.
Tabular Model Types
In contrast to multidimensional “cubes”, in tabular you think in terms of “tables”. Rather than defining measures that only aggregate according to specified dimensions and attributes within those dimensions, measures in a tabular model are calculated against whatever they’re able to (usually defined by the relationships you create between your tables). Additional measures don’t increase the size of your database, nor do they increase processing time when you refresh your data.
In-memory Import vs DirectQuery
Similar to how multidimensional has MOLAP and ROLAP, tabular has in-memory (aka import) and DirectQuery.
In-memory imports and heavily compresses all of the data into a new database that is stored in memory, hence the name. The calculation engine (aka Vertipaq) then answers queries against this heavily compressed data. Because Vertipaq is so incredibly efficient at performing calculations and the data is so heavily compressed, the response times are often faster than the simple calculations in a MOLAP cube, and sometimes even faster than just fetching a pre-aggregated. It’s bonkers.
DirectQuery is for those, again, that want real-time data. Similar to ROLAP for multidimensional, DirectQuery will aim to pass through any queries it can to the underlying data source by converting the DAX into efficient SQL. If there isn’t a SQL equivalent of parts of your query it will instead temporarily load a small cache of the data it needs and the calculation engine will work against it. From my experience, the query response times quickly become painful as soon as you start to introduce more complicated measures. As well as this, your data refresh is likely bottlenecked by transformations you made on the source data before it’s event available to DirectQuery (e.g. if your DirectQuery Tabular model is built on top of a data warehouse that is periodically refreshed from its own underlying transactional database). On top of all of that, the types of measures able to be created in DirectQuery are limited.
Why I always recommend developing an in-memory tabular model
If you can’t tell already, I’m highly biased towards developing an in-memory tabular model. But, in the spirit of fairness I’ll reiterate the main reasons why you should want to as well.
- You can skip the data warehouse (blasphemy, I know), and do your dimensional modelling directly in the extract-transform-load (ETL) process within tabular’s query editor (aka Power Query). This saves you a bucket load of development time as well as gives you access to an ETL process that appears to be slowly taking over the world.
- You can transfer existing embedded tabular models from Excel or Power BI into your consolidated model (and get a bunch of new features in the process). It also let’s you grow your own little workbooks into something your whole department or company can use (the sky’s the limit!).
- The DAX formula language is incredibly powerful, and if you have experience with formulas in Excel you’re already off to a mediocre start.. with power comes great responsibility (and learning).
- You can host your model in the cloud using Azure Analysis Services, which alleviates the problem of needing all of the on premises hardware and static SQL Server editions, or paying for components of SQL Server that you don’t need. Also, if you host your underlying data in the cloud (e.g. in Azure SQL DB) and your tabular model in Azure Analysis Services, you can rid yourself of data gateways that funnel data from on prem to the cloud, giving your Power BI reports fantastic response times.
- You’ll get better compression of your data using tabular instead of multidimensional. This obviously depends upon the number of fact vs dimension tables you have in tabular and how easily they can be compressed, as well as the number of members and aggregations you define in multidimensional. Overall, though, you’ll normally see around ten times (or better) compression with tabular, and around three times compression with multidimensional.
I think the only real reason that you’d go with multidimensional is if you needed some very specific features that aren’t yet available in tabular, after all multidimensional seems to have been around forever so it’s a mature, feature-rich product. One of the bigger features is write-back capability, where you can write data directly into the OLAP database.
Another consideration could potentially be using DirectQuery. You’ll often seen that the main reason for using DirectQuery is that you don’t want to have any refresh latency, which I guess makes sense for data where you need up to the minute answers. In reality though, if your data set is only a few million rows you can quite easily just process it every 15 minutes if you wanted to.
The other reason that gets touted for using DirectQuery is that you might have an enormous database and can’t possibly fit it into memory. The underlying source database would have to be on the order of several terabytes before this became a problem. These large databases typically have standard dimension sizes, but fact tables that reach into the multiple billions of rows. Remember as well that you’re not bringing every column into your tabular database, as you’ll only select those relevant to your analysis. Fact tables get much better compression than dimension tables, so it’s not unreasonable to get something like 25x compression. The highest SKU on Azure Analysis Services is 400GB of compressed data, so simple math tells me you’d be able to import around 10TB of source data. If you instead went with DirectQuery over this sized dataset, your query response times would likely be enormous (depending on the measure, you could be waiting for more than ten minutes, or for more complex measures, until the end of time/you run out of patience).