A hierarchy is a concept where related items are represented as being above, below, or at the same level as each other.
Some examples of hierarchies include:
- Organisation charts with different levels of managers and employees;
- Calendars with dates organized in years, months, and days;
- Products arranged into different classes, groups, or brands; and
- Bills of material grouped into sub assemblies, kits, and components.
Each of these hierarchies include “parent” members and “child” members beneath them, and serve as a way of organizing information into different levels.
How hierarchies are implemented in Analysis Services
In the context of data modelling, each item in the above examples is an attribute (i.e. column) within a table.
It follows that Analysis Services and Power BI use hierarchies as a way to relate different columns to each other, with each column on a different level to the others. Note that this is different to relating tables, which is handled separately by the Relationship object.
The specific definition used in the Analysis Services Tabular Protocol is:
Hierarchy: A logical tree structure that organizes a record such that each member has one parent member and zero or more child members.
To get a better understanding of the components that make up a hierarchy, I think it’s worth exploring the Hierarchy object’s location within the Tabular Object Model of Analysis Services and the properties it has.
Hierarchy Object Model Location
Below is the current metadata hierarchy of the Hierarchy object within the Tabular Object Model (TOM).
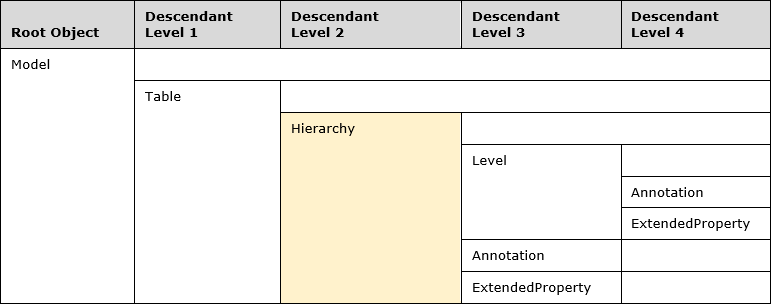
I’ll have to be careful not to write myself into knots when referencing the hierarchy of the Hierarchy object.
Note that the Hierarchy object is a child object to the Table object, meaning it will inherit properties such as the table location.
You can also see that the Hierarchy object contains the Level object for each of its hierarchy levels.
Hierarchy object properties
Within the Hierarchy object there are the following properties:
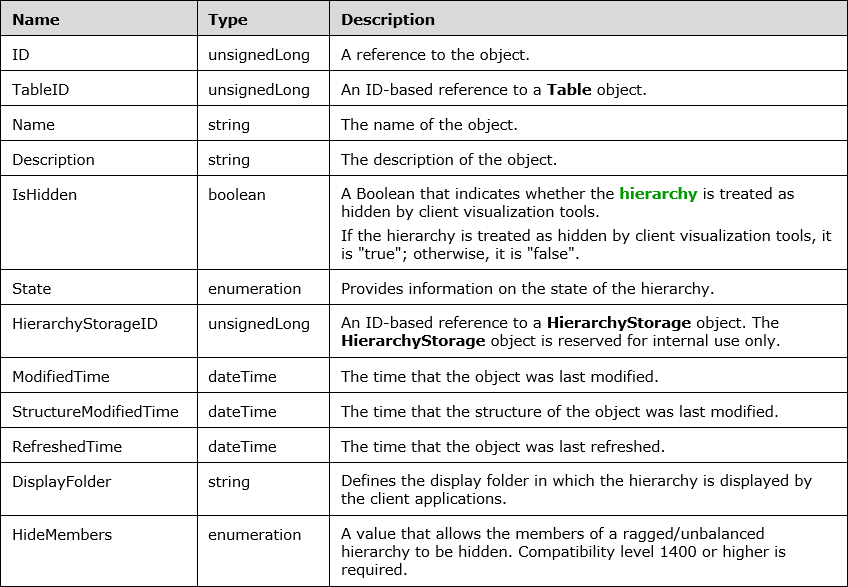
I’d like to call out a few of the above properties:
- TableID - the hierarchy will belong to a specific table.
- Name/Description - the hierarchy can have its own name and description separate to that of the table.
- IsHidden - it can be hidden if needed.
- DisplayFolder - it can be organized into its own display folder like any other column or measure.
- HideMembers - it can have a property that gets read by Excel (as of January 2019 Power BI does not respect this property) in which blank members are hidden. More on this later.
Hierarchy Level Object Properties
Underneath the Hierarchy object is the Level object. Below are the properties of each of the hierarchy levels:
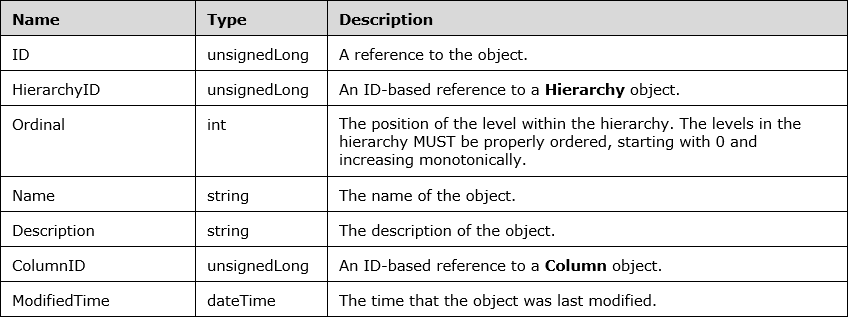
To highlight some of the properties:
- ColumnID - this is the column that the hierarchy level is based on. It is a pointer to the column and does not create a copy of the column’s data. Important: There is no concept of a ParentColumn-ChildColumn structure. Instead there must be one column per level.
- Name - despite referencing another column, the level can have its own name separate to that of the column it references.
- HierarchyID - this links the level back to the hierarchy it belongs to.
- Ordinal - this is a 0-based index that shows where to place the level relative to other levels within the hierarchy, with 0 being the top level.
The purpose of hierarchies
Now that we know the basic structure of how hierarchies are implemented, let’s explore why you’d want to use them.
The best explanation I’ve read is from Marco Russo and Alberto Ferrari’s book:
You can think of them [hierarchies] as predefined pathways through your data that help your users explore down from one level of granularity to another in a meaningful way.
— p. 190, Tabular Modelling in Microsoft SQL Server Analysis Services, 2nd Edition
In other words, hierarchies provide intuition on how different columns relate to each other and provide a guide for how you may want to structure your Pivot Tables and other visualizations.
Other advantages to using hierarchies include only needing to add one item (the hierarchy) to your report instead of many, meaning that report building could be quicker for new users. Note that in Excel the entire hierarchy must be used within a field, whereas Power BI allows you to use individual levels from a hierarchy.
Because each level can be renamed, you’re also able to have different names for the same columns if they mean different things to different departments. However, I’d caution against this as it can easily cause confusion. A much better solution is to get everyone using the same terms for the same data.
Finally, hierarchies (beginning in SQL Server 2017 / 1400 level compatibility) allow you to implement ragged hierarchies.
Different kinds of hierarchies
Now that I’ve mentioned “ragged hierarchies”, it’s probably best to start explaining the different kinds of hierarchies that you might encounter.
Ragged hierarchies
A ragged hierarchy is a hierarchy where not all items have children objects down to the lowest level.
Patrick Leblanc has a great video explaining this topic (below), but essentially a ragged hierarchy is one where there are blanks in your hierarchy, and that your blank members only have blank child members.
Ragged hierarchies are supported in 1400 compatibility level models, and possible in Power BI Analyze in Excel, but not yet officially supported (as of January 2019) by Power BI visuals (they ignore the HideMembers property). See the feature request here.
Here is how you can add ragged hierarchies to a published #PowerBI model for Analyze in Excel using #TabularEditor.
— James Fancke (@jdfancke) January 4, 2019
I hope that some day Power BI Desktop will allow you to edit this property (and that PBI visuals will respect it!) pic.twitter.com/8YWTkM0ICV
Christian Wade has commented that they are currently working on implementing ragged hierarchies into Power BI.
We want to get this working in Power BI. Starting with consumption, then authoring. It doesn't work the same as HideMemberIf in MD
— Christian Wade (@_christianWade) January 5, 2019
Natural vs Unnatural hierarchies
Natural hierarchies are where all identical values within a hierarchy column all have the same parent value. An example of this is where each product SKU belongs to a brand. There are no cases where the same product SKU value belongs to different brands.
An unnatural hierarchy is one where the same value in a hierarchy level has different parent levels. An example of this is where the value “January” can belong to multiple years.
Attribute hierarchies vs user defined hierarchies
The Analysis Services Tabular Protocol defines an attribute hierarchy as per below:
Attribute hierarchy: An implied single-level hierarchy, based on a single attribute, that consists of all the members of the attribute. An all-level member can optionally be enabled for an attribute hierarchy.
What this effectively means is that in Analysis Services Tabular, each attribute (i.e. column) has an attribute hierarchy automatically generated for itself. These attribute hierarchies are what you descend when you use MDX formulas (and when you’re using Excel cube formulas). More information on attribute hierarchies can be found here and here (applies to Analysis Services Multidimensional).
Because there is virtually no control over attribute hierarchies in Analysis Services Tabular, this post is focused solely on user defined hierarchies.
A user defined hierarchy is what you, the data modeller, are able to develop in Analysis Services Tabular and Power BI, and is exposed as a hierarchy that can be dropped into Excel PivotTables and Power BI visuals.
Closing remarks
The aim of this post was to provide an introduction to the theory of hierarchies.
In my next post I’ll be putting this theory to practice with how you’ll want to prepare your data for a hierarchy, how you can create hierarchies objects using SSDT and Tabular Editor, and some practical hierarchy use cases.
Feel free to leave any comments or corrections below.