See here on why you might want to learn these languages for Power Query and Power Pivot, and see here for where they fit within creating a data model that you can analyse to get quick insights.
In this post I hope to give a brief comparison of M (formerly “PQFL”) and DAX.
What do M and DAX stand for?
M – “Mashup” Language

“M” I guess would stand for “mashup” because it’s a language that specializes at just that. Previously it used to be known as “PQFL”, standing for Power Query Formula Language. Why “M”? From what I gather the joke is that it was just the next programming letter after “L”, however others such as Matt Masson often refer to the “M” standing for “mashup”.
The “mashup” part of Power Query comes from the fact that it is fantastic at pulling in various sources of data and mashing them into clean sets of tables by combining (i.e. merging and appending) or transforming the original source data. Power Query is almost always the first step to creating a good model, and it’s a part that is important to get right if you want to reduce the size of your files and build a good foundation to build your calculations/measures on.
If you have any coding experience with “F#” (pronounced F sharp) then you’ll be at home with M as they’re quite similar. If you’re not familiar with F#, as I’m not, then don’t worry as I’ll eventually teach you the basics of M and how to use it.
M is used in Power Query, and Power Query in turn is an interface that’s embedded within Excel, Power BI Desktop, and Visual Studio after installing the SQL Server Data Tools (SSDT) add-in.
DAX – Data Analysis eXpresions
DAX stands for Data Analysis eXpressions. I can’t blame Microsoft for not using the “E” instead of the “X” in eXpressions, “DAX” definitely sounds cooler than “DAE”.
DAX is used in Power Pivot, and similar to Power Query, Power Pivot is also embedded within Excel, Power BI, and Visual Studio after installing SSDT. While DAX isn’t the same as the formulas in Excel, you’ll notice that they look very similar. This is because the team that made DAX tried their best to make it an easy transition for the existing Excel user base.
So what’s the same? Well, for one, some of the formulas are actually exactly the same e.g. SUM([ColumnName]).
The main difference that you have to get used to when using DAX is that you’ll always be performing your calculations on columns or tables rather than performing calculations on cells (unless you’re creating calculated columns, however this is generally an unnecessary and bad habit).
If you’re used to working with Tables in Excel you might be more comfortable with DAX, but it definitely takes some getting used to. To jog your memory - when you create a table in Excel (ctrl+T), your formulas on the table of data automatically convert to table notation that ends up looking something like:
=SUM(Table1[Column 2])
Because you can only work on tables/columns, the creators of the language have highly optimized it for this type of calculation as well as added new formulas outside of what you’ll be used to in Excel.
So what do Power Query and Power Pivot do? And why should you bother to learn their respective formula/programming languages?
The long version is that you should just read my last couple of posts here (#1) and here (#2). The short version is that you use PQFL to shape your data and clean it up before dumping it into your data model (i.e. Power Pivot) where you create measures, calculated columns, and calculated tables (PBI Desktop + Visual Studio only).
Why 2 different tools instead of 1?
The main reason that Power Query was developed rather than just improving Power Pivot comes down to specialisation. Traditionally the “ETL” or Extract, Transform, and Load section of analysis has always been separated from the analytical processing logic - I guess because you need an inherently different framework for unpivoting vs aggregating.
Another way of putting it is that doing a VLOOKUP in Excel uses different logic than using a SUM formula, and even though Excel formulas can do both, a VLOOKUP can barely handle 100k+ rows whereas Power Query will keep churning away after 10m+ rows.
Power Query also often pulls information from databases and needs its instructions to be translatable into SQL to allow query-folding (query folding is where the application gets the server to perform the calculations instead of your local machine).
Because of these differences, Power Query and Power Pivot have 2 separate programming languages (that are also different to Excel’s formula language).
Competitive Advantage
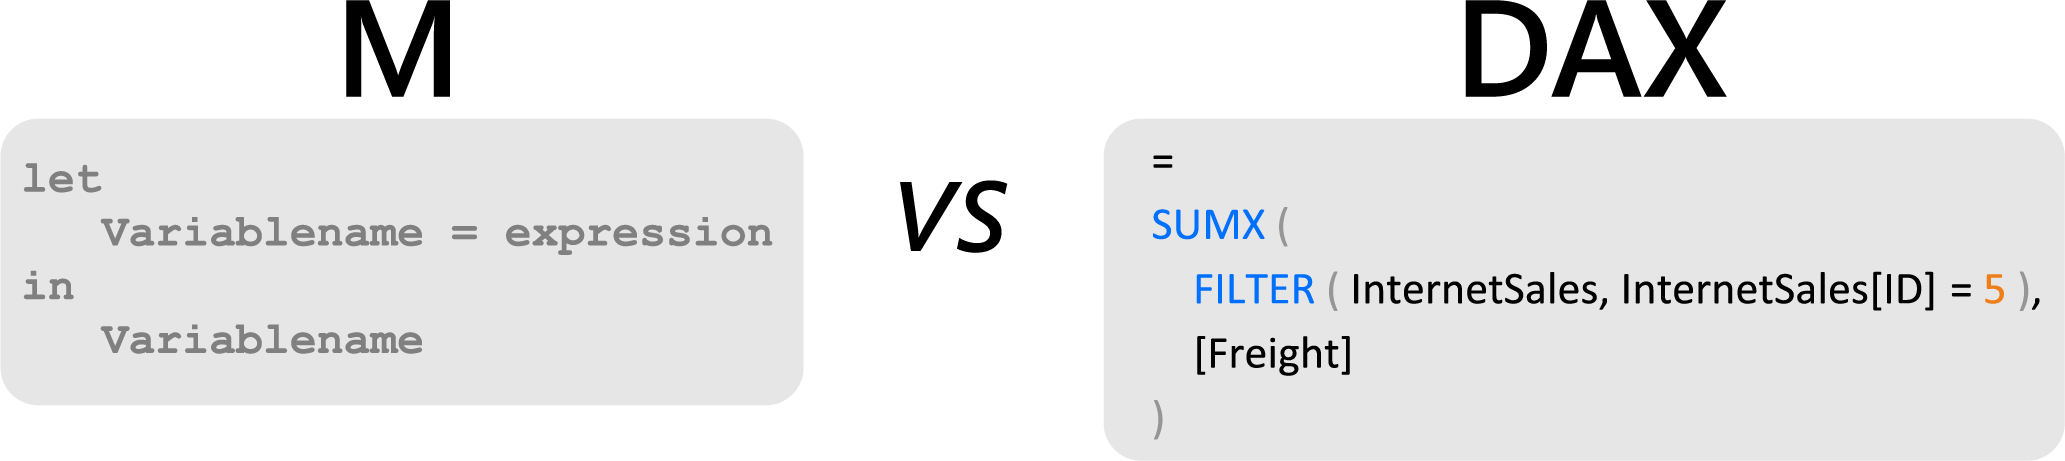
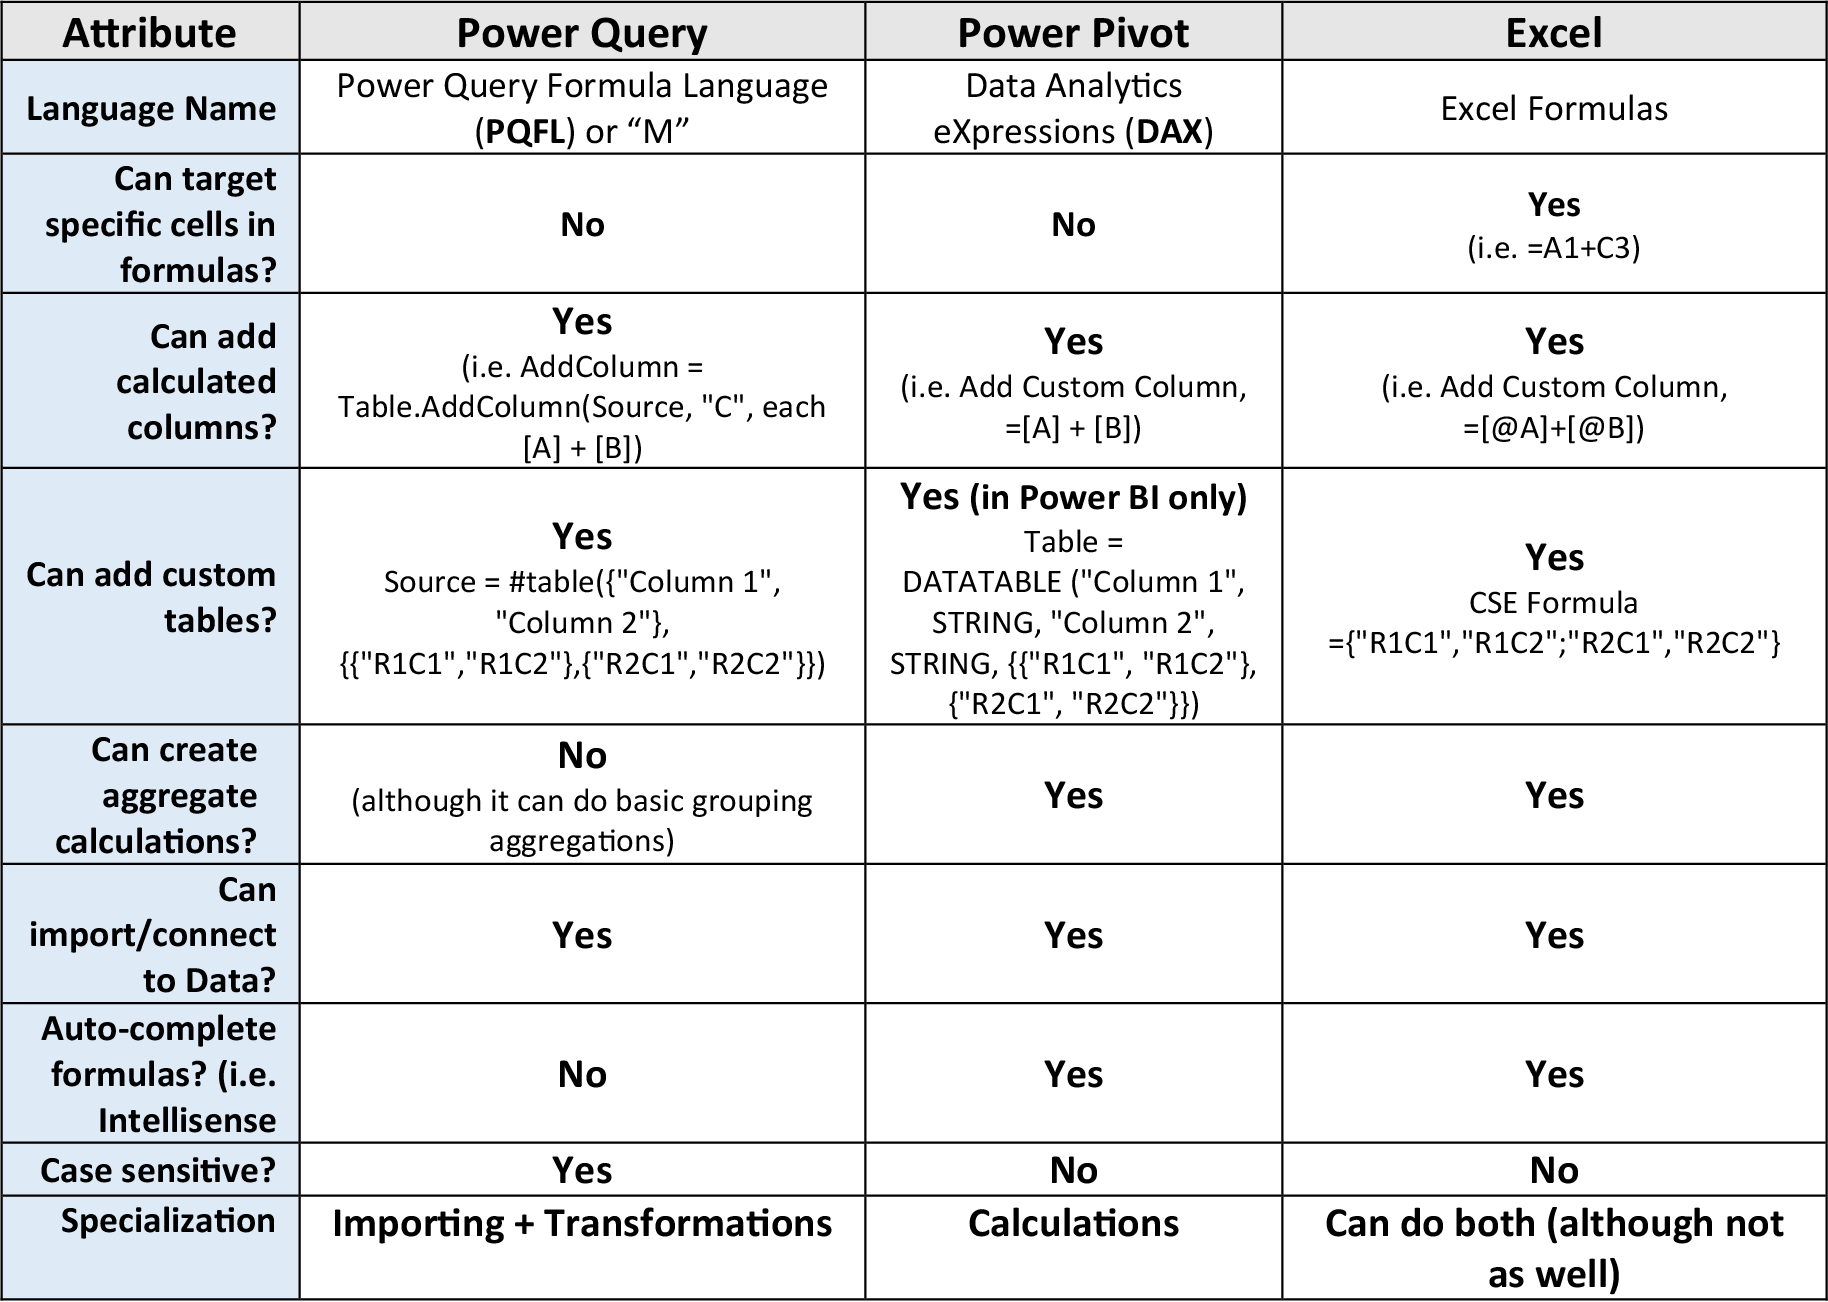
Let’s do a quick comparison of these languages to give you an idea of what they look like and what they’re good at.
See my next post here on where to get your hands on Power Query and Power Pivot.
Hopefully this is the last piece of housekeeping before we can get started doing some practical exercises!
These are only some of the differences between the M and DAX, but hopefully as I go through practical exercises in future posts you’ll gain a real understanding of where their respective strengths lie.